Examples of nanoindentation data
Warning
Only square or rectangular indentation grids can be loaded into the Matlab toolbox.
Warning
Only .xls or .xlsx file can be loaded into the Matlab toolbox. Or Matlab code has to be updated. See the section ‘New results file’ below.
Note
For 2D maps, only a sheet with average values at a given indentation depth is enough. But for a 3D mapping, sheet with mechanical properties as a function of indentation depth are required.
File examples from ‘MTS/Agilent’
For a 2D map: MTS_example1_25x25.xls
For a 3D map: MTS_example3_5x5_testSlice.xlsx
File example from ‘Hysitron’
For a 2D map: Hysitron_example_10x10.xlsx
File example from ‘ASMEC’
For a 2D map: ASMEC_example_20x11.xlsx
File example after crop and interpolation steps
For a 2D map: MTS_example1_25x25.xls_interp_81x81.xls Don’t forget to set ‘Agilent’ for the equipment, when you load an .xls file generated using the TriDiMap GUI.
New results file
In case of other or new experimental results file, the most important is to know the pattern of the indentation grid. Given below a list of potential indentation patterns:
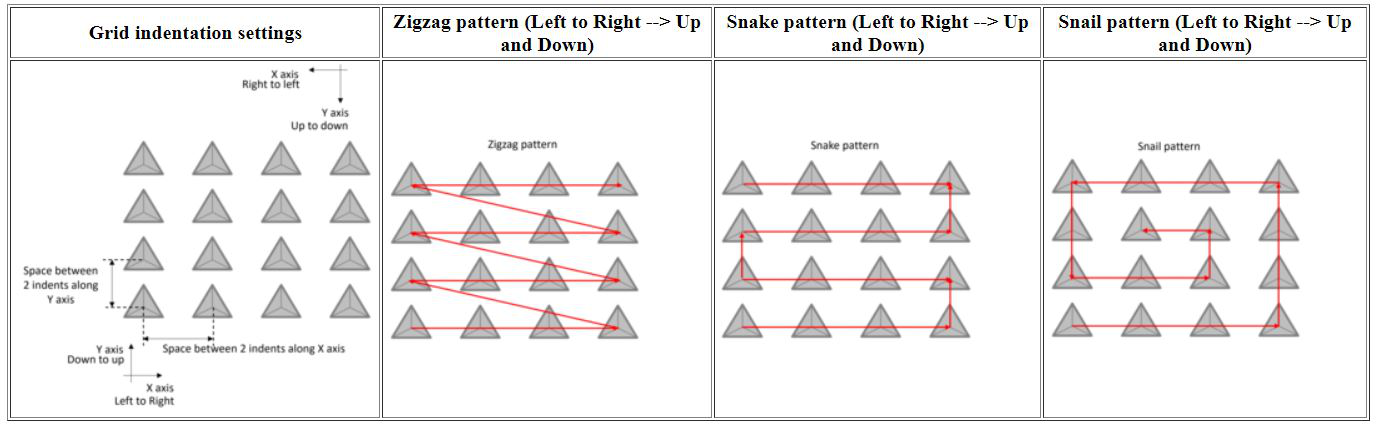
Figure 44 Examples of existing indentation grid patterns
For example, the following figure shows the pattern of a typical indentation grid obtained using the software (e.g. Testworks…) of MTS/Agilent.
The Matlab function to modify to load specific indentation results file is: TriDiMap_loadingAllTests.m
Contact me, in case of special data file format.
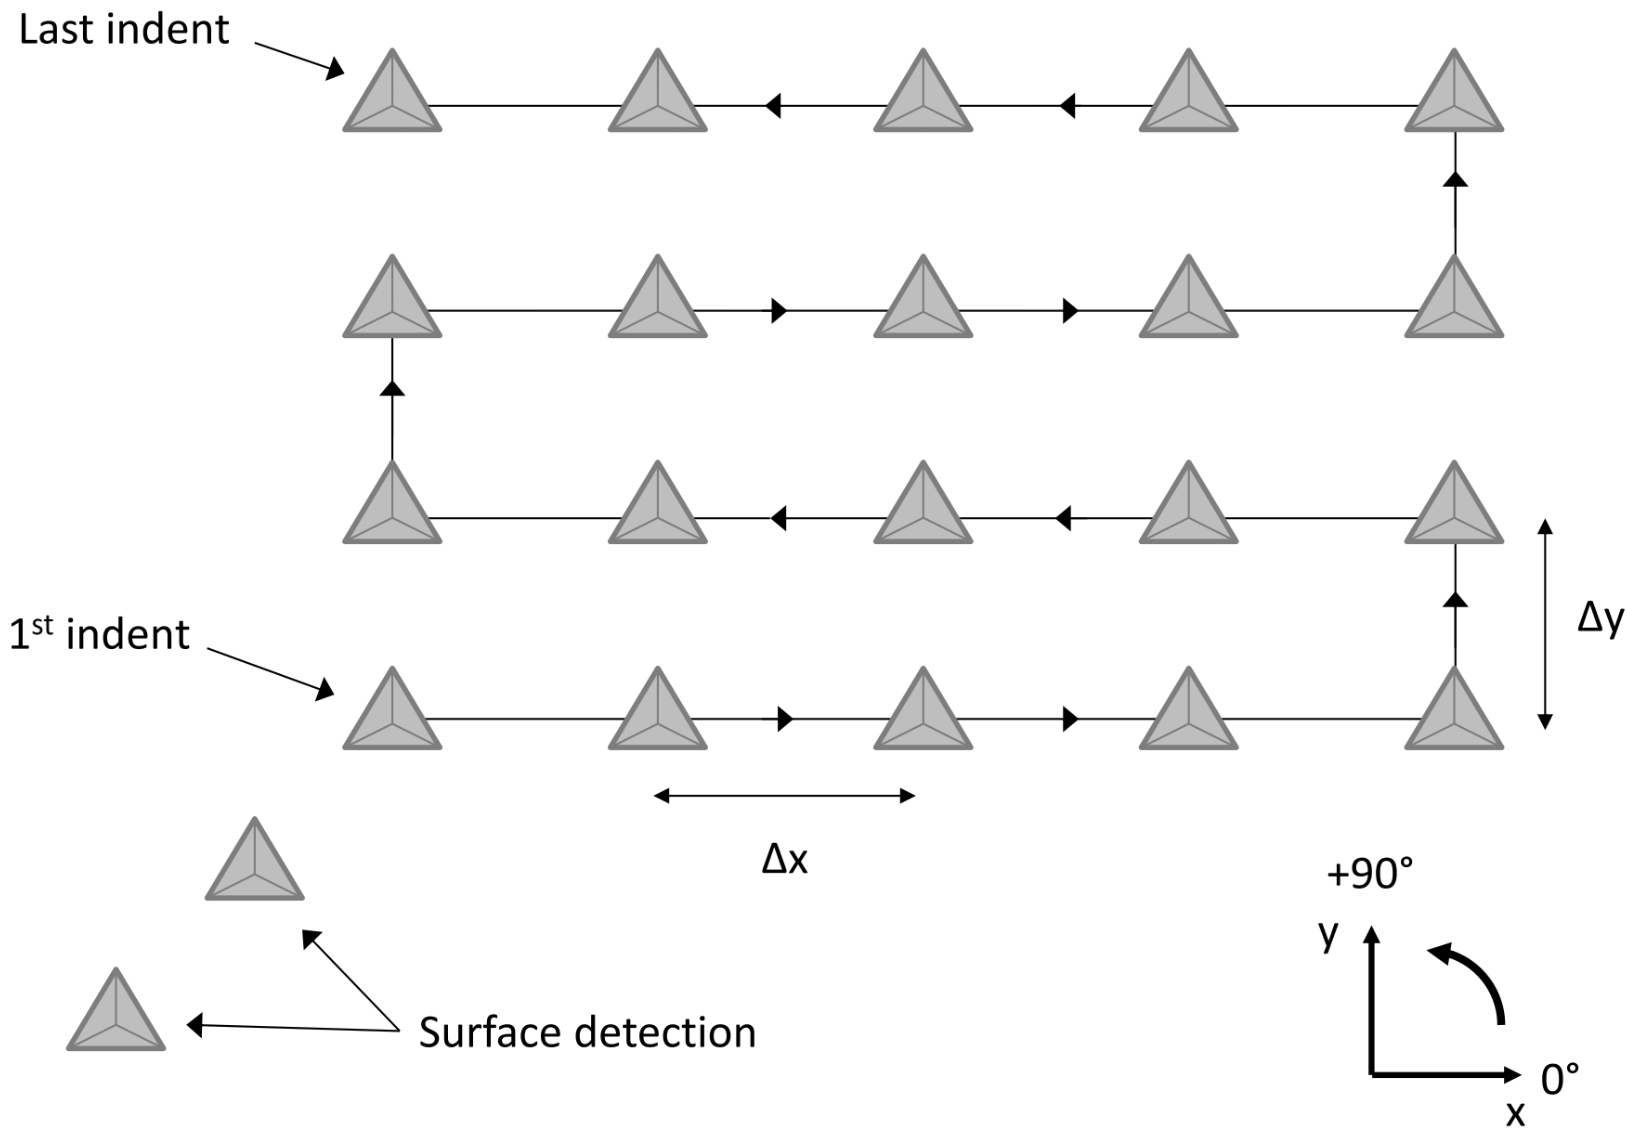
Figure 45 Example of indentation grid pattern using a MTS/Agilent nanoindenter